An urbanising world
David Satterthwaite examines global trends in the size, growth and distribution of the world’s urban population. He also considers climate change and COVID-19.


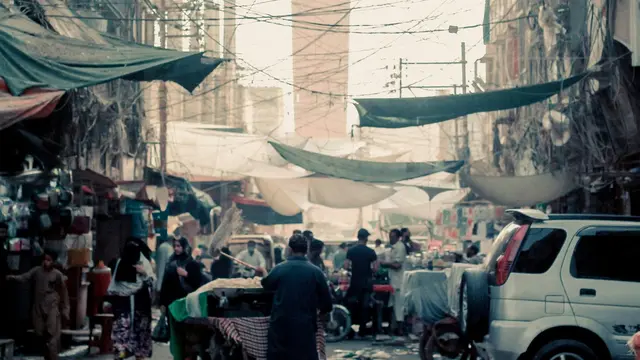
Thailand is one of many nations transforming from a predominantly rural country to an increasingly urban one. Bangkok has a population of more than 9 million, or close to 13% of the country's population (Photo: Bryon Lippincott via Flickr, CC BY-ND 2.0)
This blog looks at the size of the world’s urban population, the scale of its growth and how its distribution has changed between regions and between countries.
The size of the world’s urban population
The world’s urban population today is around 4.4 billion people – more than the world’s total population in 1975. Over the last 60 years, the number living in urban centres has grown more than fourfold; today, the proportion of urban dwellers reaches 56.2%, compared to less than 15% in 1900 and 34% in 1960.
Many aspects of urban change in recent decades are unprecedented – not only the size of the world’s urban population and its level of urbanisation, but also the number of countries becoming more urbanised, the size of their urban populations and, as the first three blogs in this series explored, the size and number of very large cities. The table below shows how the time needed for one billion people to be added to the world’s urban population has decreased dramatically.
The time needed for one billion additional urban dwellers
| World’s total urban population | Time taken |
|---|---|
| 0 to 1 billion urban dwellers | 10,000 years (circa 8000 BC to 1960) |
| 1 to 2 billion urban dwellers | 25 years (1960 - 1985) |
| 2 to 3 billion urban dwellers | 18 years (1985 - 2003) |
| 3 to 4 billion urban dwellers | 12 years (2003 - 2015) |
| 4 to 5 billion urban dwellers (projected) | 13 years (2015 - 2028) |
| 5 to 6 billion (projected) | 12 years (2028 - 2040) |
Growth of the world’s urban population
Figure 1 below shows the rapid growth in the world’s urban population from 1960 (when it was 1 billion) to 4.4 billion in 2020. However, the growth rate of urban populations in most nations and many regions is declining.
The UN Population Division provides figures on the average annual rate of change of urban populations for five-year periods from 1950. For most regions and many nations, 2015-20 brought the lowest rate of change recorded going back to 1960-65. This included Asia, Latin America and the Caribbean and Northern America.
For 2015-20, sub-Saharan Africa saw its second lowest rate of change for its urban population since 1960-65. This is also the case for least developed countries (LDCs), but remember that most nations in sub-Saharan Africa are within this grouping.
Figure 1: Growth in the world’s urban population by region from 1960 to 2020 and projected to 2040
How the distribution of the world’s urban population is changing
Figure 2 shows the distribution of the world’s urban population between the nine nations with the largest urban populations in 2020 and the rest of the world. In 2020, China has a fifth; India has 11%.
Figure 2: Distribution of the world’s urban population in 2020
The table below shows the changing regional distribution of the world’s urban population from 1960 to 2020 and projected to 2040. In 1960, Europe and Northern America had 48% of the world’s urban population; by 2020, they had less than a fifth.
Asia alone contains 54% of the world’s urban population in 2020, even though half its people still live in rural areas. It has increased its share of the world’s urban population from 35% to 54% over the last 60 years.
Africa has 13% of the world’s urban population in 2020 compared to 5% in 1960. This is larger than Europe’s and nearly twice that of Northern America, even though it is often (incorrectly) perceived as being overwhelmingly rural.
From 2000 to 2020, all four regions in Europe had a declining share of the world’s urban population. This is part of a longer-term trend. In 1910, the nations that now constitute Europe had nearly half of the world’s urban population; by 2020, they had 13 per cent.
Northern America’s share in the world’s urban population has also declined in recent decades, along with Latin America and the Caribbean after their share had increased for much of the 20th century.
The world's urban population is projected to grow by 1.56 billion from 2020-40. Eighty-three percent of this growth is expected in Asia (52%) and sub-Saharan Africa (30%). The chart below shows that much of the growth projected for the world’s total population in 2020-40 is in urban areas in low- and middle-income countries.
Figure 3: The distribution of global population growth across rural and urban areas, 2020-2040
The table above showing the distribution of the world’s urban population highlights the dramatic increase in the level of urbanisation in certain regions between 1960 and 2020: in Africa from 19% to 43%, and in Asia from 21% to 51%.
Particular sub-regions had even larger surges – for instance, Western Asia going from 36% to 72% urban in these 60 years, or Eastern Europe from 49% to 70%. However, the scale of these surges in urbanisation levels are not unprecedented; regions in Europe – and also the United States and Japan – had periods when their level of urbanisation increased just as rapidly.
Distribution of urban population by countries’ per capita income
One of the most profound urban changes has been the growing proportion of the world’s urban population in low- and middle-income countries – and within this in the LDCs. In 1960, high-income countries had 45.3% of the world’s urban population; this fell to 22.6% in 2020 (see the table below). It is middle-income countries that have the largest increase in the share of the world’s urban population.
Percentage of the world’s urban population by countries’ per capita income and other UN categories
|
|
1960 |
1980 |
2000 |
2020 |
Projected for 2040 |
|---|---|---|---|---|---|
|
More developed regions |
54.7% |
43.4% |
30.8% |
22.9% |
18.4% |
|
Less developed regions |
45.3% |
56.6% |
69.2% |
77.1% |
81.6% |
|
Least developed countries |
2.3% |
3.8% |
5.8% |
8.5% |
12.6% |
|
High-income countries |
47.4% |
38.1% |
28.7% |
22.6% |
18.5% |
|
Upper-middle-income countries |
32.2% |
36.2% |
40.4% |
41.6% |
37.4% |
|
Lower-middle-income countries |
18.5% |
22.9% |
27.0% |
30.2% |
35.3% |
|
Low-income countries |
1.8% |
2.7% |
3.8% |
5.5% |
8.7% |
While high-income countries' share of the world’s urban population is diminishing, we lack data for earlier periods and it is likely that what are high-income countries today had a higher share of global urban population for 1900-50.
The graph below shows the increasing share of global urban population in upper middle income and lower-middle income countries; the share of low-income countries has grown in recent decades but is still relatively small: 6% in 2020.
The growth in the world's urban population 1960-2020 by countries' per capita income group and projected to 2040
Aggregate urban statistics for categories of countries such as “low-income” or “least developed”, or for continents or regions, can also be interpreted as implying comparable urban trends for the countries within these groupings.
But they obscure the often great diversity in urban trends between nations – and also within most nations. They also hide the very particular local and national factors and international influences that drive or shape these trends. This is an issue that will be taken up in the next two blogs.
Notes on climate change and COVID-19
There is no point in writing about urban issues with a forward looking perspective without a strong focus on climate change. In particular, how urban development must change both in dramatically reducing greenhouse gas emissions and in its capacity and willingness to adapt to climate change’s (increasing) impacts. Climate change issues are to figure prominently in future blogs.
Now COVID-19 demands our attention and our commitment to act. This pandemic was not anticipated, even as the World Health Organization has been asking for more attention to new and emerging diseases for over two decades.
Of course, it brings massive disruption to urban governments, enterprises and residents struggling to cope with cases and to protect vulnerable groups. The billion or so residents of informal settlements face higher risks – densities so high that self-isolation is very difficult, a lack of piped water to their homes making handwashing difficult and income sources threatened or gone.
Following guidelines for physical distancing are usually impossible. So we need to learn from and support community organisations in these settlements to develop what works best in each context – in working with government and external agencies to stop the spread of COVID-19, in treating those who are infected and in measures to ensure everyone has access to sufficient food and income (that for many informal settlement dwellers has to include rent).