Alternative data sources for cities and communities
In the latest in our series of blogs and interviews focusing on the transition to a predominantly urban world, David Satterthwaite looks at community-driven data collection and mapping.


The Muungano wa Wanavijiji federation of Kenyan slum-dwellers’ associations used a balloon to take aerial photos of the streets in Mathare informal settlement in Nairobi (Photo: copyright UCL Development Planning Unit)
As my previous blog discussed, when censuses are done well (carried out regularly, almost everyone covered) and their data is available to local governments and civil society, they are one of the most precise and inclusive data sources.
But as recently noted in The Economist (subscription required), some high-income nations are no longer carrying out censuses, on the basis that governments already have data available – for instance on individuals’ health, employment and residence.
This won’t work in nations where there are no such records, though, because so many people do not live at a registered address, work in the informal economy and use informal health care services. So censuses are essential.
Seeking alternative data: cities are doin’ it for themselves
Findings from relevant research programmes can help address some of the gaps in data. It is from detailed case studies that we learn about the less visible aspects of a city. Research can enrich our understanding of informal settlements and their residents’ livelihoods, but it cannot provide the data needed for all settlements within a city.
Many city governments have responded to the deficiencies in official data by collecting their own. This includes drawing together all relevant data held by different departments to provide a common database from which all can draw.
One much-admired example is the Belo Horizonte Urban Health Observatory – founded in 2002 through a partnership of the Federal University of Minas Gerais and the Belo Horizonte Municipality in Brazil. Working with the city planning department, it has developed a city-wide database of urban indicators and statistics.
Participatory processes can also be seen as tapping a new information source – the knowledge brought by those engaged in these processes. For instance, participatory budgeting discussions taking place at neighbourhood, sector and city-wide levels set priorities for what the city government does and funds.
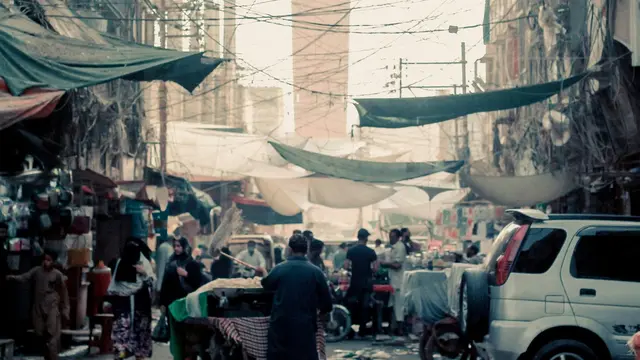
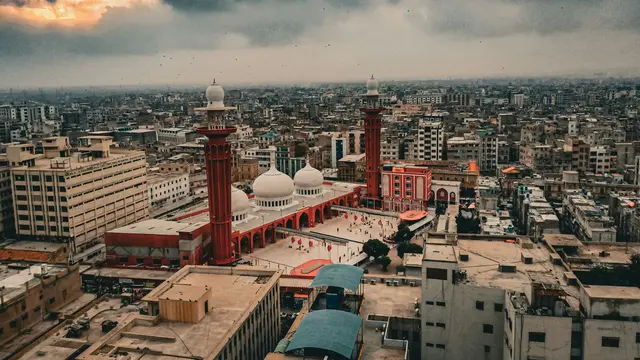
The Urban Resource Centre in Karachi is an NGO contributing city-wide data and amplifying voice for low- and lower-middle-income groups, small businesses and informal sector operators. The centre has built an information base about Karachi's plans and development for all to use.
Community-driven mapping and data collection
Over the last two decades, new methods have been developed to map informal settlements from satellite and other earth observation data. High-resolution satellite maps have proved very useful in improving the quality and detail of city maps, and can provide data on building characteristics, site layouts and urban expansion.
Viewed in isolation, these maps tell us very little about who lives and works in the settlements mapped, and the quality of public services – and nothing about the residents’ needs and priorities. But they can provide the base map for informal settlements, helping to guide data gathering by residents.
It can also be combined with data from censuses, service providers and health systems to support planning.
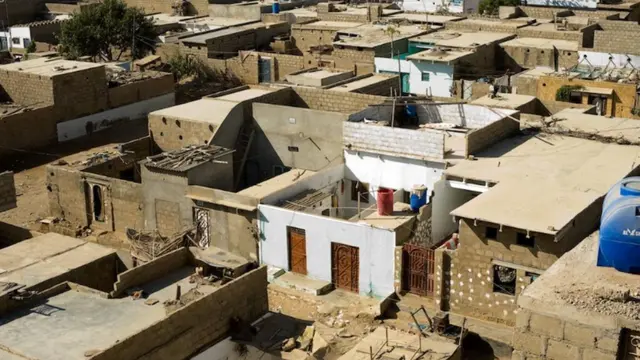
Perhaps the most surprising and the most transformatory new source of city data is that collected by grassroots organisations and federations as they profile, map and enumerate informal settlements. The challenge should not be underestimated, given that many cities have a third or more of their population scattered across dozens or hundreds of informal settlements.
There are now more than 30 national slum/shack dweller federations. These are federations of informal savings groups; most savers and saving group managers are women. They have developed methodologies to document and map informal settlements and have applied these to thousands of informal settlements in over 500 cities.
Much of this is part of the ‘Know your City’ campaign, gathering data on settlements that have long been ‘invisible.’ They overcome residents’ hostility to external data gatherers because it is being done by them and engaging them about their priorities.
To get the attention of city government, data must be comprehensive – so the federations profile and map all informal settlements. And when the government agrees to support the upgrading of informal settlements, the federations carry out the equivalent of censuses – interviewing each household, and numbering and locating on a map each house or shack using a geographic information system (GIS).
So the ‘slum’ census is their census, their data. And it serves their plans and priorities.
Case study 1: upgrading Magada/Ward 7
The four maps show different stages in developing maps to guide the upgrading of Magada/Ward 7, an informal settlement with over 35,000 inhabitants in Epworth, just outside Harare. The plans were developed after an upgrading agreement was reached between the residents and their community organisations, and local and national governments.
The enumeration and maps were developed by residents, supported by the Zimbabwe Homeless People’s Federation, Dialogue on Shelter Trust, and urban planning students. It was the first time that a city government in Zimbabwe had supported upgrading, and with such wide-ranging participation. This case study is also discussed in the paper 'Building resilience to climate change in informal settlements'.
The two maps below are a satellite image of Epworth, showing the location of the area to be enumerated, and a digitised map where the data collected was superimposed on to the satellite image.


Click on the images above to expand them and then scroll through
The two maps below are examples of maps developed from the enumeration showing current land use, building use and conditions of buildings. Other maps provide the basis for developing consensus on bringing in access roads and on rehousing those displaced by this.


Click on the images above to expand them and then scroll through
Nambia’s federation works with government
The Shack Dwellers Federation of Namibia developed the capacity to undertake enumerations and mapping of informal settlements and, with support from the national government and a local NGO, developed the Community Land Information Programme that profiled and mapped all informal settlements in Namibia, covering more than 500,000 people without secure land tenure.
Integrating grassroots knowledge
Knowledge is generated from the data that informal settlement dwellers and their federations collect. But these informal settlement dwellers also bring knowledge on how to collect this data and how to use it in planning, negotiation and action.
The conventional process of governments collecting data to inform their decision making can in part be replaced by governments engaging with informal settlement dwellers and their federations direct, and drawing on their knowledge (and capacities) as well as their data.
The next blog in this series will look at the list of the world’s fastest growing cities and examine the factors that determine which cities make it on to this list.
Further reading
- Making the invisible visible: generating data on ‘slums’ at local, city and global scales, IIED Working Paper
- Using GIS to map informal settlements in Cuttack, India, Environment & Urbanization journal
- How the Community Organizations Development Institute (COD() (PFG) in Thailand supported organised communities to map their settlement to guide the upgrading
- A community-driven enumeration (PDF) of all households living in informal settlements in Kisumu, Kenya
- Case studies of community-driven enumerating and surveying of informal settlements in Mumbai, five cities in Uganda, Accra, Cape Town, and Dar es Salaam, Environment & Urbanization journal