Which cities went up or down the ranking of the world’s largest cities?
IIED senior fellow David Satterthwaite is curating a series of blogs and interviews on global urban change. In this blog he looks at rapidly growing cities that moved into the list of the top 100 cities, and those that fell off the bottom of the list.

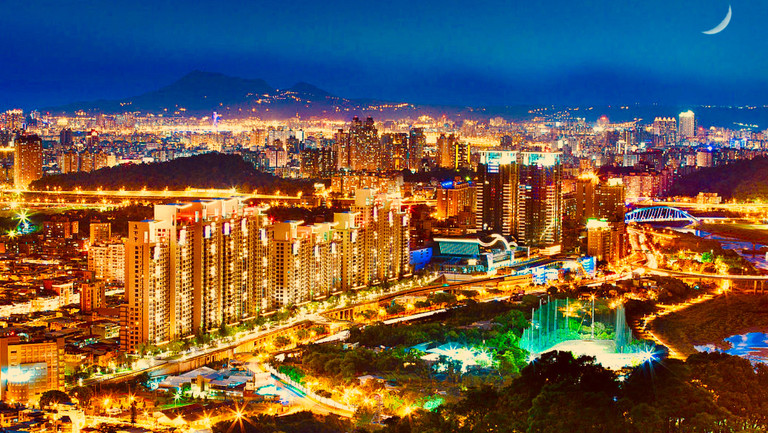
New Taipei City in Taiwan was only promoted to city status in 2010 (Photo: HeeheemalU, via Flickr, CC BY-SA 4.0)
The first two blogs in this series looked at how the list of the world’s 100 largest cities changed from 1800 to today, and provided a more detailed examination of the 20 largest cities.
This blog explores movements within the top ranked cities: which cities grew into the largest 100 or went rapidly up the rankings – and those which fell down the list, or out of it. With the previous blog having analysed the 20 largest cities, this blog also looks at the ‘next 20’ (i.e. cities ranked 21-40) and the last 20 cities (i.e. rankings 81-100).
Rises and falls
Cities that grew into the 2020 top 100: 13 rapidly growing cities did not appear in 2000 but by 2020 have made it on to the 100 largest cities list: five are in Africa and eight in Asia (including four in China). In 1950, three of these cities did not exist: Shenzhen, Brasilia and New Taipei City (Xīnběi S).
Cities that fell off the list: 13 cities that were among 100 largest cities in 2000 had dropped off by 2020; one in Africa, two in Asia, two in Latin America, four in Europe and four in Northern America. This includes a group of cities from high-income nations (Berlin, Boston, Detroit, Milan, Montréal and Rome) and two Brazilian cities (Pôrto Alegre and Recife).
Movers and shakers: 20-41
Of cities ranked 21 to 40, most have been in the top 20 in earlier years (six were in the 20 largest cities in 1950). Several are capital cities of large population middle- and upper-income nations: Bogotá, Jakarta, Krung Thep (Bangkok), Lima, Moscow, Paris, and Seoul.
Some cities were too small to make the 21-40 bracket for 2000, but by 2020 had risen dramatically up the ranks: Lahore (up 19 places), Chengdu (up 15) and Bangalore (up 14). By 2035, Lahore and Bangalore are both projected to be on the largest 20 list, which is astonishing given that in 1950 they were 90th and 106th respectively.
(All of the tables below use a projected figure for 2035. The arrows denote whether that city has risen or dropped in the rankings since the previous ranking).
| Largest city ranking | 1800 | 1900 | 1950 | 2000 | 2020 | 2035 |
|---|---|---|---|---|---|---|
| Bangalore | 107 | 133 | 106 | 41 | 27 | 19 |
| Lahore | – | 107 | 90 | 42 | 23 | 16 |
Buenos Aires, Guangzhou, Tianjin, Chennai (Madras) and Shenzhen just miss the 2035 20 largest city list. In 1800, Guangzhou (previously Canton) was the world’s third largest city but its population declined during the 19th and much of the 20th centuries.
But as the centre of China’s Pearl River Delta Metropolitan Region, it clusters many very large and large cities including Shenzhen – some argue this makes the Pearl River Delta the world’s largest city.
| Largest city ranking | 1800 | 1900 | 1950 | 2000 | 2020 | 2035 |
|---|---|---|---|---|---|---|
| Buenos Aires | 136 | 24 | 7 | 11 | 15 | 21 |
| Guangzhou | 3 | 34 | 70 | 26 | 22 | 22 |
| Tianjin | 33 | 27 | 21 | 31 | 20 | 23 |
| Chennai | 45 | 38 | 44 | 34 | 30 | 24 |
| Shenzhen | nf | nf | 1730 | 35 | 26 | 25 |
Eleven of the cities on the 21-40 list in 2000 fell down the rankings by 2020; the biggest drops were Los Angeles, Nagoya and Seoul. Chicago also tumbled from 24th to 40th – but it is worth recalling Chicago’s remarkable growth history, having become the world’s fifth fifth largest city in 1900. This was astonishing since it had only been incorporated as a town in 1833. The other three cities had had periods of very rapid growth prior to 2000.
| Largest city ranking | 1800 | 1900 | 1950 | 2000 | 2020 | 2035 |
|---|---|---|---|---|---|---|
| Los Angeles | nf | 182 | 11 | 12 | 25 | 25 |
| Nagoya | 58 | 88 | 24 | 22 | 36 | 54 |
| Seoul | 26 | 110 | 74 | 18 | 35 | 47 |
| Chicago | 236 | 5 | 8 | 24 | 40 | 49 |
The top 100’s ‘last 20'
It is common for cities towards the bottom end of the rankings to move up or down 10-20 places in just two decades. Some make much bigger leaps: Ürümqi (Wulumqi) moved up 76 places in the two decades after 2000; Changsha moved up 53 places and Nairobi, 52.
| Largest city ranking | 1800 | 1900 | 1950 | 2000 | 2020 | 2035 |
|---|---|---|---|---|---|---|
| Ürümqi (Wulumqi) | 38 | 290 | 760 | 176 | 100 | 99 |
| Changsha | 73 | 93 | 146 | 148 | 95 | 100 |
| Nairobi | Nf | 0 | 598 | 143 | 90 | 60 |
The largest falls down the rankings were: Xinbei (29 places), Sydney (21) and Washington DC (20).
| Largest city ranking | 1800 | 1900 | 1950 | 2000 | 2020 | 2035 |
|---|---|---|---|---|---|---|
| Xinbei | 162 | 70 | 99 | 130 | ||
| Sydney | 244 | 49 | 34 | 67 | 87 | 95 |
| Washington DC | 215 | 81 | 59 | 61 | 80 | 90 |
Some words of caution for comparing city populations
Very large cities usually have more than one boundary, so there is more than one figure for their population size in any year. This means their ranking will vary, depending on which boundary is used.
The population figures for some large cities are based on long-established city boundaries enclosing areas of only 20-200 square kilometres; others are for planning or administrative regions with many thousands of square kilometres and large populations (as in the Pearl River Delta mentioned above).
Chongqing has 16 million or over 30 million inhabitants, depending on which boundary is used. The UN Population Division’s World Urbanization Prospects painstakingly reports on the sources and definition used for each city population. It also notes whether this is based on the urban agglomeration or some other defined boundary (for instance the city proper). The UN seeks to use the urban agglomeration figures wherever possible.
The next blog in this series will describe the vast gaps in official data for cities and how this is driven by the obsession with national statistics and international comparisons. But it renders invisible so many aspects of city and neighbourhood development.
About the author

