IIED's best of 2014: multimedia
The third and final round-up in a series looking at our best and most popular content of 2014 focuses on 10 of the most interesting ways IIED has used multimedia over the past 12 months.


An interactive data visual that illustrates the scale and speed of urban transformation that research by IIED has sought to document and describe.
For our research to have the greatest impact possible, and to engage and appeal to our audiences, sometimes we need to use innovative methods of communication.
In the last year we've embraced some of the exciting new formats to help tell the story of our work – while not forgetting the more traditional and familiar printed and video formats. Below are 10 examples.
Seeing the pattern of cities
") One of the most viewed pages on our website in 2014 was this interactive data visual that illustrates the scale and speed of urban transformation and exposes patterns that couldn't otherwise be seen so easily.
One of the most viewed pages on our website in 2014 was this interactive data visual that illustrates the scale and speed of urban transformation and exposes patterns that couldn't otherwise be seen so easily.
Initially covering all cities with 750,000 inhabitants, drawing on data from the United Nations Population Division and updated to include those with 500,000, the data visual enabled users to see how and where cities have grown since 1800, as well as giving predictions for future growth up to 2030.
Produced by our Human Settlements Group in conjunction with Kiln, this was widely shared through social media.
Reporting in a new way
") For many years our printed annual report has been among our most important and popular publications, but last year we widened the audience for this review of our activities by producing a bespoke online version, www.ar2014iied.org, that uses multimedia, especially video, in a complementary way.
For many years our printed annual report has been among our most important and popular publications, but last year we widened the audience for this review of our activities by producing a bespoke online version, www.ar2014iied.org, that uses multimedia, especially video, in a complementary way.
Aspects of the narrative are told using videos and interactive elements to provide a snapshot of the institute's areas of work over the past few years, plus a look ahead to our plans and ambitions for the next half-decade.
The online version includes a video introduction from director Camilla Toulmin and filmed interviews with staff showing how the work of IIED and its partners is helping to ensure that policy on the world's pressing issues reflects the priorities of poorer communities. Users can also navigate to find key information about the institute and read stories about some of our programmes and projects.
Using animations to network
") In the wake of predictions that the oceans will be fishless by 2050, we produced an animation to highlight our work on the economics of marine and coastal fisheries.
In the wake of predictions that the oceans will be fishless by 2050, we produced an animation to highlight our work on the economics of marine and coastal fisheries.
With more than one billion people relying on fisheries to survive, IIED is pioneering the use of economic incentives to stop the decline in fish stocks due to the effects of habitat destruction, over-fishing and climate change.
The animation produced by our Sustainable Markets Group was also designed to promote an online community, FishNet, created to bring together people with an interest in sustainable fisheries and to connect policymakers, researchers and citizens.
Presenting information differently
") Although we had previously made a number of its presentations publicly available via our SlideShare platform, 2014 was the year that we made a concerted effort to make as many as possible viewable to a wider audience.
Although we had previously made a number of its presentations publicly available via our SlideShare platform, 2014 was the year that we made a concerted effort to make as many as possible viewable to a wider audience.
Especially since its acquisition by LinkedIn, SlideShare is on a path to be an essential way for professionals to share content online, and over the course of the year, we uploaded 99 presentations – a mixture of Powerpoint and PDF documents – from our own experts and those who came to present information to us. These were viewed almost 18,000 times.
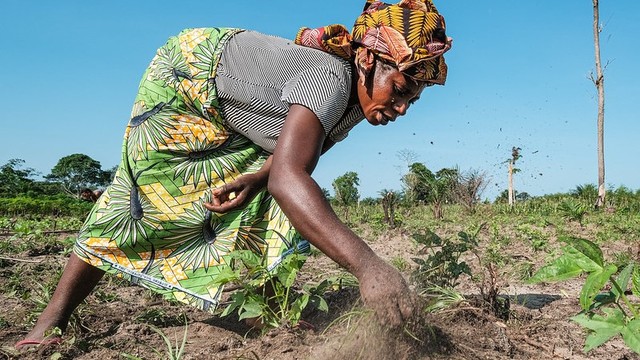
Our most viewed presentation was one given by Bill Crabtree during a seminar at IIED in March on conservation tillage. Better known as no-till Bill, Crabtree is one of the most fervent promoters of no-till farming, and he shared his experience on how he has contributed to convert large areas of abandoned degraded land into productive fields. The presentation on SlideShare includes a video interview with Crabtree conducted at the same event (see slide 105).
Vlogs and videos: seeing is believing
") Our YouTube channel again proved popular in 2014 as we created videos that ranged from an in-depth conversation between the incoming and departing chair of the institute's board of trustees to edited extracts from interviews with our founder, Barbara Ward. There were also numerous speeches and interviews from partners and delegates at international events.
Our YouTube channel again proved popular in 2014 as we created videos that ranged from an in-depth conversation between the incoming and departing chair of the institute's board of trustees to edited extracts from interviews with our founder, Barbara Ward. There were also numerous speeches and interviews from partners and delegates at international events.
Among the 132 videos we uploaded – more than one every three days – were a significant number of vlogs by IIED senior fellow Saleemul Huq at the 8th Annual Community Based Adaptation Conference in Nepal in April and at the UNFCCC climate talks (COP20) in Lima, Peru in December.
Huq's global standing in the climate change adaptation community means his views carry weight and insight, and his vlogs allow him to throw light on the issues and processes in which he is involved in a personable way, as can be seen with his criticisms of the COP20 planned final text just before the conclusion of the summit.
Indigenous imagery
") Our work alongside partners to profile indigenous biocultural heritage territories and the role they play in development, conservation and adaptation was the focus of a visually stunning photofilm in November.
Our work alongside partners to profile indigenous biocultural heritage territories and the role they play in development, conservation and adaptation was the focus of a visually stunning photofilm in November.
The six-minute film was presented at a global gathering on protected areas, the IUCN World Parks Congress, in Australia that month, and was also promoted at the 20th Conference of the Parties (COP20) in Lima, Peru in December.
The film used a collection of stunning photos of these culturally important areas in Peru, China and India to explain how such communities promote simultaneous goals of endogenous development and biodiversity conservation, based on indigenous and traditional land tenure, production systems and cultural identity.
One BRIC at a time
") Hot on the heels of our interactive data visual on cities, our Human Settlements Group produced a further data visual examining the relationship between economic growth and urbanisation.
Hot on the heels of our interactive data visual on cities, our Human Settlements Group produced a further data visual examining the relationship between economic growth and urbanisation.
Because it contained slightly more complicated data, the data visual was accompanied by an introductory screencast video focusing on the BRICS – Brazil, Russia, India, China and South Africa – that featured IIED principal researcher Gordon McGranahan explaining what users could see as he manipulated the data. Users could watch the countries move across income-urbanisation space and chart progress from 1980-2010, or highlight individual countries and see how their statistics changed.
McGranahan also wrote a complementary blog that illustrated examples of countries' urbanisation-income signatures and explored some of the conclusions that could be drawn from the study.
At the end of the year, the data visual was shortlisted for the annual interactive data visual competition run by On Think Tanks.
Storytelling at events
") 2014 was the year that IIED embraced social media, particularly Twitter, in a big way, and we actually tweeted more in the past 12 months than in the previous four years.
2014 was the year that IIED embraced social media, particularly Twitter, in a big way, and we actually tweeted more in the past 12 months than in the previous four years.
One of the main contributors to this prolific production was an increase in our coverage of conferences, presentations and other events involving our research and our experts. This consequently provided a further opportunity to collate this coverage, and embed the content within our website. The Storify platofrm is a curation tool that builds content using social media. It is a way of presenting and making sense of otherwise very muddled information, ranging from tweets and Facebook posts to photos, videos, links to related webpages and presentations and much more.
We produced 33 Storifys over the course of 2014, which were viewed more than 5,500 times. Among the events covered was the annual meeting of the Green Economy Coalition, which saw leaders from civil society, media, policy and business assess and discuss the status of the transition to green economies.
Technology presents an answer
") Although we had run webinars prior to 2014, last year saw our Legal Tools team embrace the idea of using the latest technology to connect partners and promote learning across the globe.
Although we had run webinars prior to 2014, last year saw our Legal Tools team embrace the idea of using the latest technology to connect partners and promote learning across the globe.
The first, focusing on 'Striking down adverse investment laws: success stories from Indonesia', took place in March and saw two legal empowerment practitioners from peasants' rights and indigenous peoples’ organisations in Indonesia share their experiences.
This was followed by a webinar on 'Investor-state arbitration: Lessons from civil society advocacy' in May, 'Citizen power: Sustaining paralegal programmes to put knowledge back into communities' hands' in October, and 'Paving a path towards redressing grievances and holding investors accountable' in November.
These, along with the presentations and question-and-answer sessions that followed, were recorded and made available, accompanied by complementary blogs from members of the Legal Tools team.
Testing the water
") Ahead of the traditional lull in activity over Christmas and the new year, we thought we would try something new: a multiple-choice quiz.
Ahead of the traditional lull in activity over Christmas and the new year, we thought we would try something new: a multiple-choice quiz.
While designed to be a fun piece of content, with a mildly humorous section at the end that ranked how well respondents had done, the answers also promoted an area of our work by linking to one of our blogs, news releases or publications from during the year.
Among the advantages of the quiz was that it would not date quickly during a period of general public holiday and it could be easily be shared on social media. All 20 questions provided 20 individual pieces of content that could be scheduled in advance for throughout the festive period.
Was it worth it? Definitely. Although the quiz turned out to be slightly more difficult than we had intended, in the space of two weeks it racked up as many views as one of our top performing blogs from the entirety of 2014. We also received significant positive feedback, from within and outside the institute.
Coming soon
In 2015, IIED will be launching a new section of www.iied.org focusing on its Communications department and our strategies for disseminating research, ranging from the audiences we are identifying and some of the innovative methods we are using, to insight into our print and digital products and how we monitor and evaluate the impact they have.
This section will include regular blogs from our Communications team, such as the one written in March by communications director Liz Carlile discussing the challenge of the "impenetrable research report" to communications professionals. Read 'Three steps for reaching the right audiences in an information-saturated world'.
We'd also love to hear about and see your own examples of great multimedia content. Please share them in the comments box below.
About the author